
In my previous post (Money Talks. Can You Understand What It’s Saying?) I discussed the importance of becoming familiar with some of the jargon, terms, and acronyms that will help you understand your business.
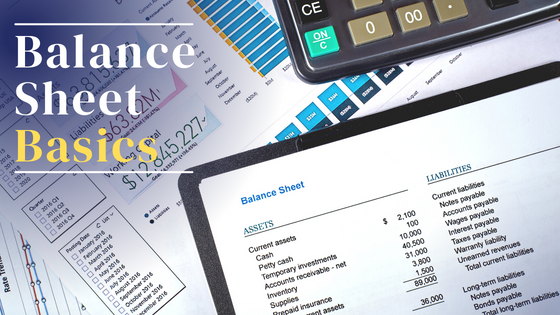
One of those terms was “balance sheet”, which I described as an overview of what the business owns as well as what the business owes. The balance sheet also includes what has been invested in the business (either by you, or by sources outside the business).
While that might sound very simple, it’s true that a lot of information goes into a company’s balance sheet. The report is reviewed “as of” a certain date and will naturally include different data each time the report is run – even though the same categories are being measured.
The balance sheet shows the effects of revenue and expense activity from the P&L. As an example, if money is paid out for rent (which shows on the Income Statement), cash is then reduced on the balance sheet.
Categories you’ll find on your balance sheet
The balance sheet is divided into three sections: assets, liabilities, and equity. Let’s look at each one in turn.
Assets are items of value. They are often physical in nature (real estate, inventory, equipment, cash, stocks)and can also be intangible, such as brands, “goodwill” or inventions.
Liabilities are financial obligations owed to an entity (or entities) outside of the company.
Equity is an ownership interest in a firm. It’s also used to describe the difference between the market value of an asset, and any debt against it. For example, if your business automobile is worth $50,000 and your outstanding loan against it is $30,000 your equity is $20,000. Outside investments as well as owner’s investments will show up in the Equity section of the balance sheet.
How the balance sheet works
The balance sheet is divided into two parts – and they must equal each other (or “balance” each other out. Here’s the formula:
Assets = Liabilities + Equity
You sometimes hear this referred to as the “balance sheet equation”.
When to use your balance sheet
Review your balance sheet as of the last day of the period you’re considering. Although any time period could be considered, common review periods are the last day of the month, the last day of a quarter, or the last day of the year.
The report should be pulled based on the fiscal period of your business. Organizations often pull a balance sheet comparison report showing the current month-end with the year-end balance sheet of the previous year (i.e. report comparing 6/30/18 vs. 12/31/2017). Year end benchmarks are very important for the balance sheet review because they show the cumulative effects of the business operations, and a year’s worth of operations can change a business dramatically.
What you’ll see on the report
The balance sheet includes powerful information, such as the amount of cash on hand, current inventory levels, investments, debt (including outstanding loans), and outside investment. All of this shows as a “snapshot” at the time the report is prepared.
You can expect to see the following categories:
- Bank accounts
- Investment accounts
- Amounts owed to the business from clients (accounts receivable)
- Inventory
- Property
- Equipment
- Credit card balances (amount owing)
- Vendor balances (accounts payable)
- Loans
- Retained earnings (earnings from prior periods)
- Equity (investments from owners or others)
Why is the balance sheet important
The snapshot you receive through the balance report is an official statement summarizing the business’s financial position as an accumulated total at a point in time. Simply put, the report will show if the business is showing signs of strength or weakness.
Who prepares the balance sheet
Some business owners prepare their own balance sheets through their bookkeeping systems. Others will have this report provided by their bookkeeper. Organizations with an up-to-date accounting software should be able to prepare a balance sheet with relative ease when all activity from the time period has been accurately recorded and reconciled.
As your business grows and gets more complex, accrual accounting may be necessary. In such cases, make sure a qualified accountant or bookkeeper is prepared to record month-end journal entries every month. To ensure that this important document is being properly prepared, consider outsourcing the creation of the report to a qualified third party if no one in your organization has the necessary skills to prepare it accurately.
Who uses the balance sheet
Company owners and investors, as well as any key figures in the accounting or finance departments will want to review the balance sheet on a regular basis.
Financial institutions who have loaned money to the business – as well as those who are considering loans –plus individuals who are considering investments in the business will want to review this critical document. Without a balance sheet, you’ll stand zero chance of getting loans, infusions of capital, or other investments should your business require them – either to get through periods of financial difficulty or to assist in expanding your business.
What else your balance sheet can tell you
In addition to your “balance sheet equation”, there are many metrics that your balance sheet can provide. Here are a few key ones to get you started with balance sheet analysis:
- Quick ratio. This ratio is an indicator of a company’s short-term liquidity position, and is calculated by subtracting inventories from current assets, and then dividing that number by current liabilities. Because this ratio measures a company’s ability to instantly use liquid assets to pay off liabilities, it’s sometimes called the “acid test ratio”.
- Debt to Equity Ratio: Companies can be financed through debt or equity. The debt/equity ratio is calculated by dividing total liabilities by total equity and can reveal how a company is financing its operations.
- Working capital. The amount of capital a business has to operate the business. Subtract total current liabilities from total current assets to arrive at working capital.
- Inventory turnover. If you sell physical products, it’s important to know the number of times inventory is sold and replaced in a given period of time. You can calculate this by dividing average inventory by the cost of goods sold (which comes from the Income Statement).
- Return on equity (ROE).This important number reflects how much profit a company makes from $1 of equity. Divide net income by equity to come up with your ROE.
Is your balance sheet in the danger zone?
How are your ratios looking? Good? Bad? Not sure? You may need to make strategic moves to improve the company’s financial health. A good financial team member can help you understand what that will look like given your specific situation. See how ClaraCFO Group can help.
Up Next: The Income Statement
Now that you better understand your balance sheet, we’ll take a look at the income statement. Watch for my next post, “Understanding Your Profit and Loss Statement”.
Hannah Smolinski is the CEO of Clara CFO Group. Goal-driven CEOs making between $300k -$3M in annual revenue hire Clara CFO Group to be a strategic partners on the financial side of their business. We show them how to improve profits, increase business value, and drive sustainable growth.
Disclaimer: This blog and the linked videos are intended for educational purposes and should not be taken as legal or tax advice. You should consult with your financial professionals about your unique financial situation before acting on anything discussed in these videos. Clara CFO Group, LLC is providing educational content to help small business owners become more aware of certain issues and topics, but we cannot give blanket advice to a broad audience.


